8.1 Software design processes
System development life cycle
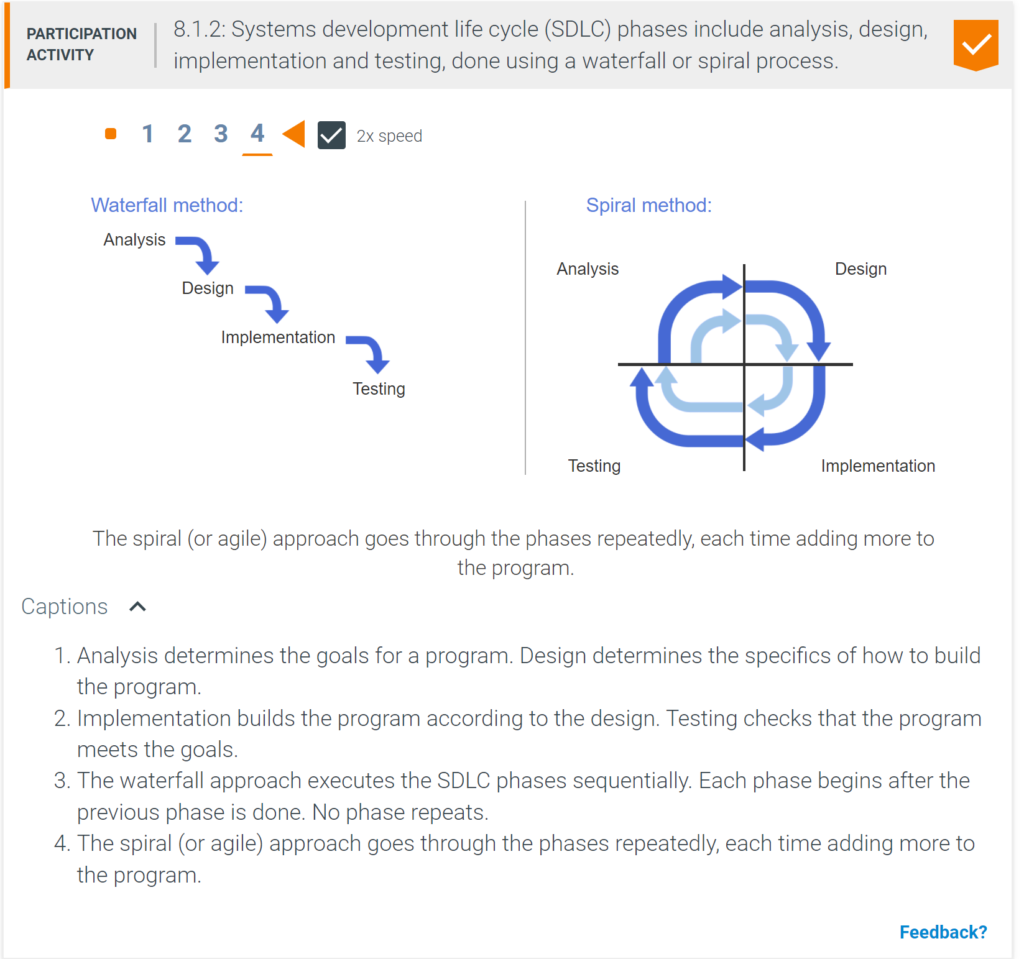
A 4-bedroom house can be built using different arrangements of phases. For one house, first a 4-bedroom blueprint might be created, and then the 4-bedroom house built per that blueprint. For another house, first a 1-bedroom blueprint might be created, then that 1-bedroom house built (and moved into), then blueprints for more rooms created, and then those rooms built.
Similarly, a program can be built using different arrangements of phases, comprising the systems development life cycle or SDLC.
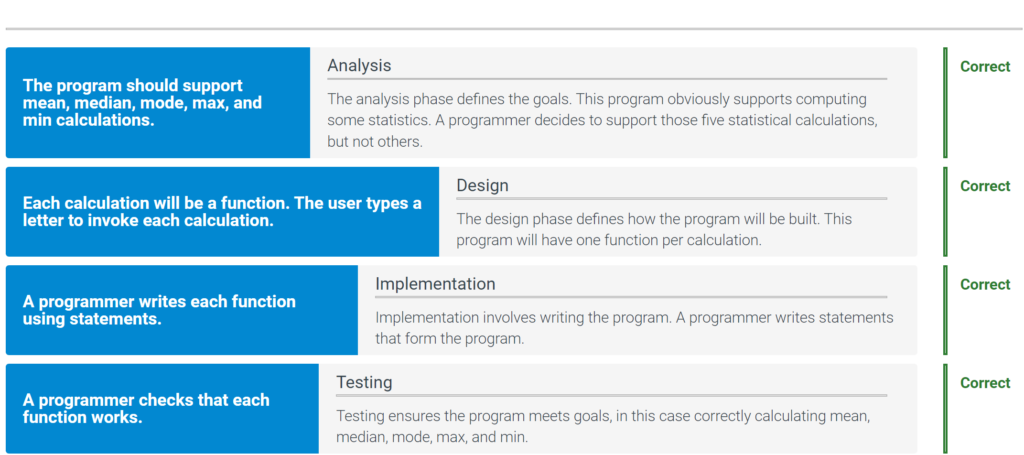
- The analysis phase defines a program’s goals.
- The design phase defines specifics of how to build a program.
- The implementation phase involves writing the program.
- The testing phase checks that the programs correctly meets the goals.
SDLC case study
A programmer is tasked with writing a web program that helps people choose among home loans. The programmer:
- Talks with 30 potential customers, learning most want to choose between different 30-year fixed rate loans, but some want to also consider 20-year and 15-year loans, and variable rate loans too. The programmer decides to support all those kinds of loans. Time: 3 weeks.
- The programmer decides to write a program running on a remote computer that generates a web page, with fields for a user to enter loan amount and years, and implementing each loan type as a function. Time: 1 week.
- The programmer implements the program for every loan type. Time: 3 weeks.
- The programmer tests the program thoroughly and fixes bugs. Time: 1 week.
The programmer releases the program to customers. Immediately, customers request a graphical comparison of the loan payment schedules, which would be easier to do using a different programming language running in the web browser. Users also rarely use the 20-year, 15-year, and variable rate options, and many state that having all those options is confusing. These changes will be quite time consuming for the programmer, who has already invested much time, the programmer leaves the program as is. The program is not very popular.
8.2 Objects: Introduction
Grouping things into objects
The physical world is made up of material items like wood, metal, plastic, fabric, etc. To keep the world understandable, people deal with higher-level objects, like chairs, tables, and TV’s. Those objects are groupings of the lower-level items.
Likewise, a program is made up of items like variables and functions. To keep programs understandable, programmers often deal with higher-level groupings of those items known as objects. In programming, an object is a grouping of data (variables) and operations that can be performed on that data (functions).
Abstraction / Information hiding
Abstraction means to have a user interact with an item at a high-level, with lower-level internal details hidden from the user (aka information hiding or encapsulation). Ex: An oven supports an abstraction of a food compartment and a knob to control heat. An oven’s user need not interact with internal parts of an oven.
Objects strongly support abstraction, hiding entire groups of functions and variables, exposing only certain functions to a user.
An abstract data type (ADT) is a data type whose creation and update are constrained to specific well-defined operations. A class can be used to implement an ADT.
8.3 UML
Universal Modeling Language
The Universal Modeling Language (UML) is a modeling language for software design that uses different types of diagrams to visualize the structure and behavior of programs. UML consists of several structural and behavioral diagrams. A structural diagram visualizes static elements of software, such as the types of variables and functions used in the program. A behavioral diagram visualizes dynamic behavior of software, such as the flow of an algorithm. For example, A UML activity diagram is a flowchart, similar to zyFlowchart, used to describe the flow of an activity or set of activities.
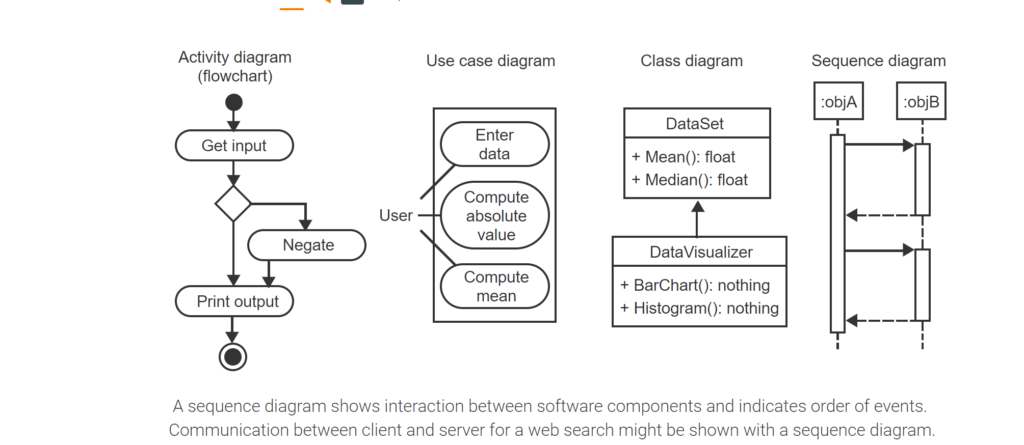
- UML has several kinds of diagrams. An activity diagram is like a flowchart, describing at a high-level the sequence of computations.
- A use case diagram shows various things a user might do. A user might enter data, compute an absolute value, or compute a mean.
- A class diagram shows a program’s parts (classes). A DataSet class might compute statistics on data. A DataVisualizer does that plus draws bar charts and histograms.
- A sequence diagram shows interaction between software components and indicates order of events. Communication between client and server for a web search might be shown with a sequence diagram.
Use case diagram
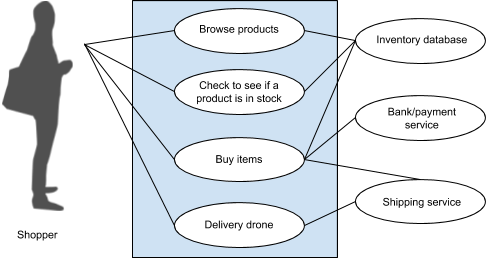
A UML use case diagram is a behavioral diagram used to visually model how a user interacts with a software program. Actions from users and the accompanying actions in software, as well as connections between different components of the software, are illustrated in a use case diagram. Use case diagrams are often used to specify behavioral requirements of programs.
Ex: The use case diagram below shows components of an online shopping system and how the customer, as well as how external services, connect to system components.Figure 8.3.1: UML use case diagram for online shopping system.
Class diagram
A UML class diagram is a structural diagram that can be used to visually model the classes of a computer program, including data members and functions. A class is a code blueprint for creating an object that is composed of data members and functions that operate on those data members.
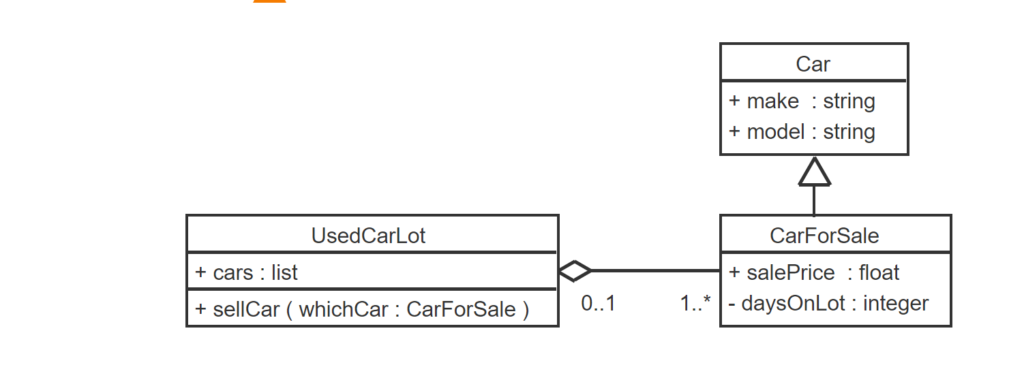
- A class diagram depicts a class’ name, data members, and functions. The “Car” class consists of two string member variables “make” and “model”.
- The CarForSale class has a float member variable salePrice and an integer daysOnLot.
- A car for sale is still a car, so the CarForSale class can inherit the make and model members from the Car class, using a programming feature called inheritance.
- The UsedCarLot class has a cars member that store a list of Cars and a sellCar member function to sell a car on the lot.
- The unfilled diamond indicates the UsedCarLot class “has” CarForSale items, which are elements of the class’ cars list.
Sequence diagram
A UML sequence diagram is a behavioral diagram that shows interaction between software components and indicates the order of events. A UML sequence diagram is commonly used to illustrate the sequence of events needed to handle a particular scenario in software.
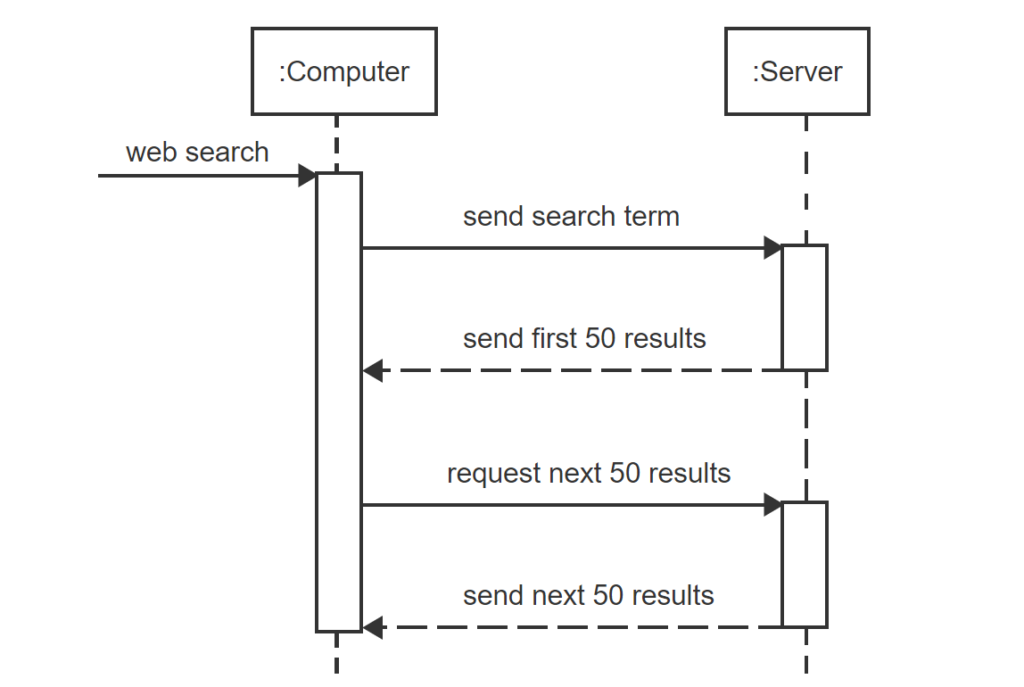
- A sequence diagram can be used to illustrate the sequence of events for a web search.
- Horizontal arrows are used to indicate communication between the computer and the web server.
- Vertical dashed lines represent the lifelines of the computer and server.
- Horizontal dashed lines represent responses from the server.
- The diagram indicates that the computer sends the search term and gets 50 results back. Later, the computer requests the next 50 results, which are sent back by the server.
UML and SDLC
UML is commonly used in various phases of the systems development life cycle (SDLC), whether using a waterfall or agile approach.
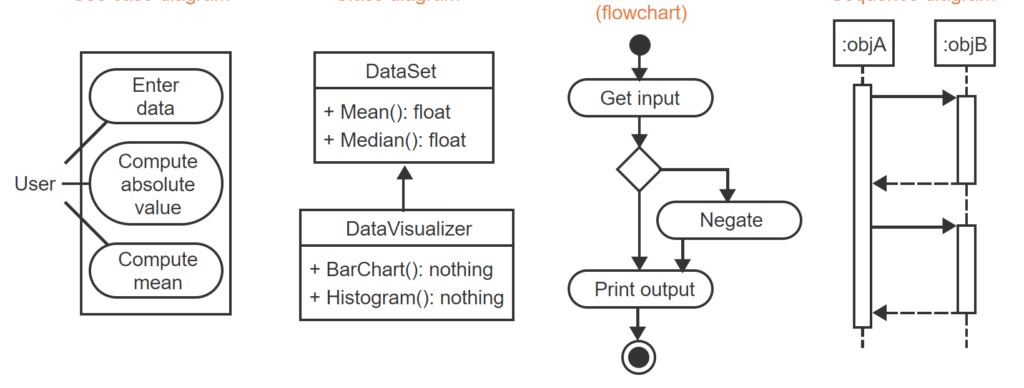
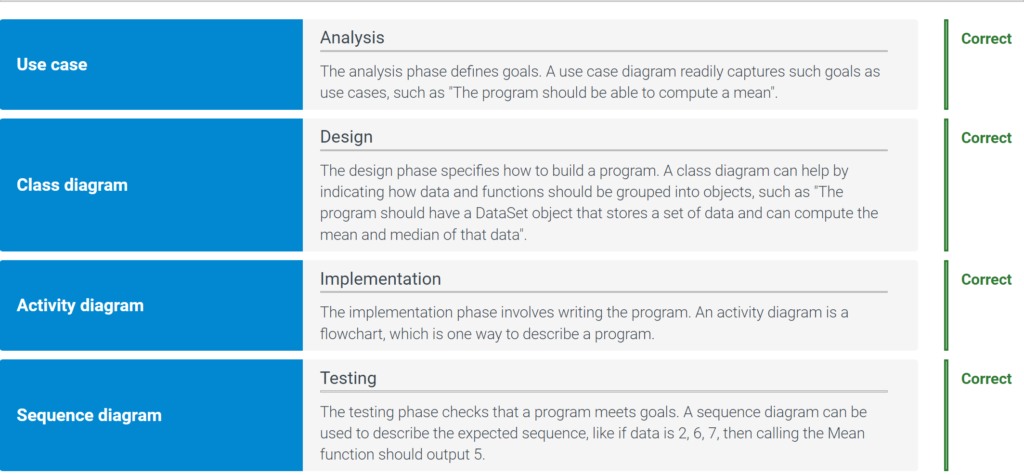
- During SDLC’s analysis phase (define program goals), a use case diagram can indicate what goals (use cases) the application should carry out.
- During design (specifics of how to build), a class diagram can lay out how to group data and functions.
- During implementation (writing the program), an activity diagram can describe the program’s instructions, branches, loops, etc.
- Finally, during testing (check that program meets goals), a sequence diagram can ensure the program generates outputs for given inputs, in the expected order.
8.4 UML in the systems development life cycle
UML use case diagrams in the SDLC
A UML use case diagram is commonly created in the analysis phase of the systems development life cycle, but may be used during several different SDLC phases.
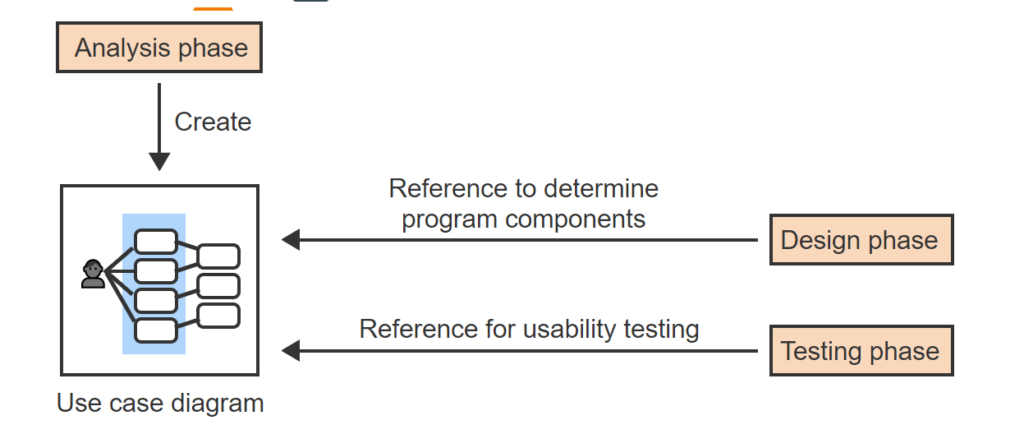
- During the analysis phase, the application’s goals are defined. A use case diagram is created to define how the user interacts with the software.
- In the design phase, the use case diagram is referenced to determine how the program is built.
- The use case diagram may also be referenced in the testing phase, such as when creating usability tests.
Class diagrams in the SDLC
A class diagram is commonly created in the design phase and used as guidance in the implementation phase. Ex: A spreadsheet application will need a class for a workbook, a worksheet, and a cell. A class diagram built in the design phase identifies such classes and members of each class.
Sequence diagrams in the SDLC
Sequence diagrams are commonly created in the analysis or design phase. A sequence diagram may be created in the analysis phase to detail how a user interacts with a software system. A sequence diagram may be created in the design phase to detail the logic of a particular function.
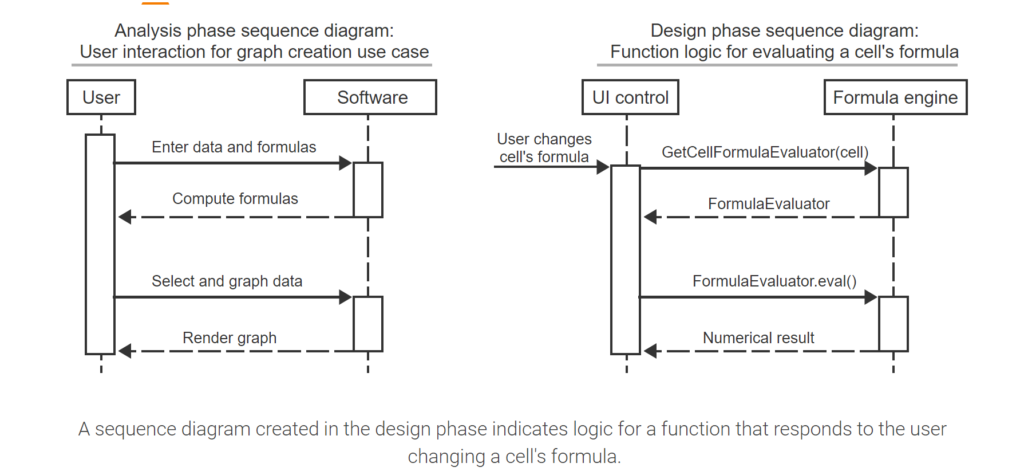
- A sequence diagram created in the analysis phase indicates behavior in a graph creation use case.
- A sequence diagram created in the design phase indicates logic for a function that responds to the user changing a cell’s formula.
8.5 Comparing the waterfall and agile approaches
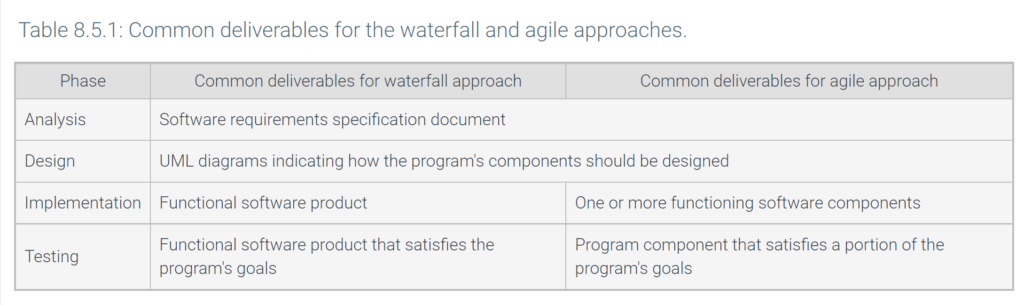
SDLC deliverables
The waterfall and agile approaches have similar phases, and thus similar deliverables. Alternatively, the spiral approach may iterate through one cycle for each major component of the software, hence deliverables being functioning components rather than a finished software product.
The analysis phase of each approach commonly produces a software requirements specification (SRS), a document describing all requirements for the software product. An SRS commonly has UML diagrams for several of the software product’s use cases.
- In the waterfall approach, the final product requirements are agreed upon early, which reduces the need to go to the client with questions during development.
- Since the waterfall process doesn’t repeat, progress is indicated by the current phase, making time-to-completion estimates easier.
- The agile approach encourages much more frequent communication between developers.
- The spiral approach reduces the amount of effort needed to handle changes in requirements.
- Significant mistakes noticed in late phases of the waterfall approach may require starting over, whereas in agile/spiral the mistakes might have been noticed earlier.
- Similarly, if requirements change in a late phase, the waterfall process can’t easily revert to an earlier phase.
- Final product design is often less certain at the start of agile development, as each iteration defines how the product evolves.
- Cycles may repeat endlessly in the spiral model if the development team keeps seeing problems. The waterfall approach may instead cut a few things and finish the product.
8.6 UML summary
This chapter’s key points included:
- UML uses different kinds of diagrams to visualize programs. A structural diagram shows static items like variables and functions. A behavioral diagram shows dynamic behavior like flow.
- A UML use case diagram is behavioral and shows how a user interacts with a program. A class diagram is structural and shows a program’s classes. A sequence diagram is behavioral and shows interactions and event orderings.
8.7 Software design processes summary
This chapter’s key points included:
- Programs may be developed in various phases known as the system development life cycle (SDLC).
- Programs may be developed in phases known as the system development life cycle (SDLC), wherein analysis defines a program goals, design defines specifics of how to build a program, implementation writes the program, and testing checks the program.
- A waterfall approach does the phases in sequence once, while an agile approach (aka spiral approach) does smaller amounts of each phase and repeats.